
The curious case of the intermittent latency spike

This short journey is about debugging an intermittent latency issue in a production application I manage. It's a Python application backed by TimescaleDB (PostgreSQL extension), running FastAPI with SQLAlchemy and asyncpg. I had planned to add request timings once I had Prometheus and Grafana up and running, but I had put off setting up the heatmap visualization, as I needed to spend time adding some more features the app needed.
However, one day when looking at some logs, I noticed from the timestamps in the access logs that once in a while, some requests that normally take 20-50ms suddenly were taking up to 2 seconds.
At a glance
Upon discovering it, I added some more logging so I could quickly filter out and see how often it happened, and my first guess was either some blocking I/O or having to wait for an available DB session.
I checked the pool stats, and it had only 2 idle of out the 5 I had defined as the pool size (also having max_overflow set to 3 for some extra headroom). So it didn't seem like slow acquisition of DB session was the issue. Atleast it wasn't having to wait for an available database session. Double checked the debug logs from sqlalchemy as well, and the checkout/checkin timestamps were tightly hugging the other logs I had, so that helped rule it out.
This issue seemed to happen only for queries hitting my TimescaleDB hypertable with timeseries data, so that indicated there was some issue with the database itself. To follow up on this, I added some timings around just the DB execution part of the API request, and lo and behold, it spent almost all its time in there.
I then jumped into psql client and did an EXPLAIN ANALYZE on the query to see if I could see some weird query planning, but it looked fine, and since all the other requests were fast, I decided to leave it be for now.
A few weeks later
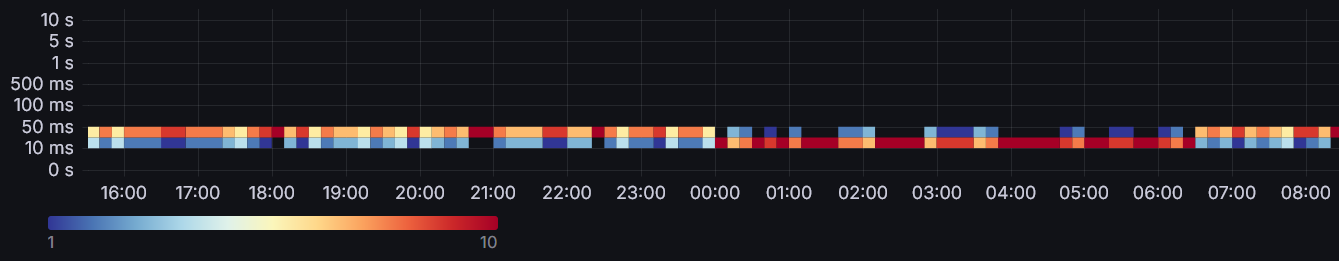
I had now added the remaining metrics to my Grafana dashboard, and the "random" latency spikes were now staring me straight in the face. Time to give it another go! Sadly, given a few weeks had passed, I had lost some context and had to catch up on what I checked last time. I figured I'd now see if I could do some timings in PostgreSQL itself, to see if it indeed was an issue with Postgres (or TimescaleDB). I ended up just enabling log_statements = 'all', and log_min_duration = 1000, and that would log all queries exceeding 1 second.
Yay, confirmed! And interestingly, it was taking long during the prepare statement, not the execute part. That briefly led me down the wrong alley of non-explicit types of parameters coming from SQLAlchemy. I then realized what should have become clear by now after looking at logs and querying in psql many times...
Breakthrough
The slow query was consistently on the 6th query after connecting (starting psql, or the app itself locally)!
I must admit this took longer than it should have to track down. Once you know that it is consistently slow after 5 queries, there are quite a lot of other blog posts on this subject as well. But given my environment, it was a bit camouflaged.
- The app has 3-4 worker instances, each with 5 available connections (3 overflow).
- I frequently deploy changes, so restarts are common.
- The latency spikes were continuing intermittently also after what would have been the 6th query for each connection.
Some details on prepared statements
Prepared statements are server side objects that can improve performance, and can be parameterized. Being able to reuse the query plan when a large number of identical requests hit the same connection can significantly improve query performance. However, as it is tied to each connection, it is deallocated when closed.
And here it gets interesting...
By default (that is, when plan_cache_mode is set to auto), the server will automatically choose whether to use a generic or custom plan for a prepared statement that has parameters. The current rule for this is that the first five executions are done with custom plans and the average estimated cost of those plans is calculated.
When querying using a prepared statement for the first five times, a custom_plan is used. That means the query is planned every time, with the parameterized values known. After the 5th, Postgres will generalize the plan and estimate if the resulting plan is more efficient than the custom plan, and use that instead. The custom plan has the advantage of knowing the parameter values, so for some special queries the generalized plan can be far worse. This can be especially impactful for complex hypertables, as the custom plan is aware of partitioning keys and can prune chunks. Generalizing a plan can take a significant amount of time, as the generalized plan may need to consider all chunks, indexes etc.
So if you suddenly see all your queries become slower after 5 executions, you might want to:
SET plan_cache_mode = force_custom_plan;
But why was my 7th and 8th query fast again?
So the increased query time was actually coming from the fact that it was performing a generalization of the query plan before executing, leading to the long latency. But why didn't I then see a continued high query latency? Well, turns out the generalized plan was indeed a tad bit faster, as it is cached and reused.
Then it struck me. Early on during development I had encountered issues with closed DB connections, so I had enabled pool_recycle at I think 600 (10 minutes) interval.
That means when connections had been alive for more than 10 minutes, the connection would be re-established before the next query would be executed.
That was it, no wonder they were popping back up from time to time. The connections were being recycled every 10 minutes, leading to the cached generic query plan to be deallocated. That meant we started with the custom plan again, until reaching 5 queries.
So to summarize, what was happening:
- I start the service
- Each API worker starts receiving requests, allocating more DB connections and executing queries
- Each connection would see a latency spike after 5 queries (on the 6th)
- But since connections were being recycled due to
pool_recycle, it often didn't reach past 5 - After spiking out, it would then be fast again, before being recycled and ready to spike again
The latter two points caused some confusion on my part and hid the fact that there was a distinct change after 5 queries, since it wouldn't always happen.
The fix
I simply just removed pool_recycle=600 and replaced it with pool_pre_ping=True. The latter does a SELECT 1 before every query, to verify the connection is fine, and will re-establish a new connection under the hood if it fails, solving the same problem. And for my case it is not a noticeable performance penalty.
Now look at the smooth flat latency graph. And see how it has also settled on a lower average than before, due to the generalized plan having better performance. After a restart, I now see latencies from everywhere between 30ms and 110ms when using the custom plan, and then a consistent 20-50ms after the plan generalization spike.
So if you experience latency spikes on your 6th query, or just consistently slower queries from 6th and onwards, remember the heuristics and plan generalization going in there for every connection!